Project Gallery
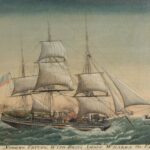
Whaling and wailing: Childbirth at sea on nineteenth-century whaling voyages Nineteenth century whaling voyages commonly lasted several years, as the vessels and crews would not return to their home port until the holds were full of whale oil. This extended separation led many whaling wives to join their husbands on board. This paper compares typical childbirth conditions, strategies and outcomes of the nineteenth century with those faced by whaling wives at sea.
 Financial Returns From U.S. Whaling Voyages In this article, Barbara L. Coffey draws from the AOWV data and other sources to analyze financial returns from U.S. whaling voyages and calculate the risk premium for the investors who participated in nineteenth-century whaling.
American Whaling Mapped An animated visualization of Matthew Maury’s collection of data from logbooks of American whaling voyages. From Data narratives and structural histories: Melville, Maury, and American whaling by Ben Schmidt: "Data visualizations are like narratives: they suggest interpretations, but don’t require them. A good data visualization, in fact, lets you see things the interpreter might have missed. This should make data visualization especially appealing to historians."
Scottish Vessels Lost in the Arctic Bowhead Whale Fishery (1750–WWI) This Overview and Table present new data analysis by Chesley W. Sanger, compiler of the Scottish Arctic Whaling voyages database.
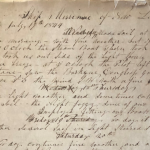 The Merrimac Journal Transcription Project The New London Maritime Society has crowdsourced the transcription of a whaling journal from the 1840s and 1850s then built a rich online exhibit. Visitors can view the original Journal of the Ship Merrimac, read transcripts (annotated with links to WhalingHistory.org), and learn more about the ship, the author and the history of the whaling industry.
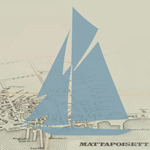 Mattapoisett Data Stories Integrating map, census, and American Offshore Whaling Voyages data, Mattapoisett Data Stories invites exploration of life in the shipbuilding village of Mattapoisett, Massachusetts, in the late 1700s and mid-1800s through interactive maps and visualizations.
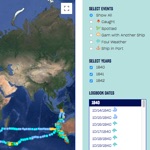 Voyage of the Neptune 1840-1842 This active map, from Mystic Seaport Museum for Educators, represents the journey of the whaler Neptune of New London, Connecticut, from October 1840 to April 1842. The map, created from the original logbook, provides insight into the monotonous and sometimes exciting life on a whaling vessel, while chronicling the weather patterns and the process of hunting whales that determine a voyage’s success.
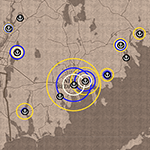 Oil & Bone: American Ports in the Golden Age of Yankee Whaling This interactive map uses AOWV data to illustrate the economic impact of whale products returned to America’s port cities from 1804 to 1876. Data visualizations and contextual narratives combine to tell the story of the industry’s ebbs and flows.
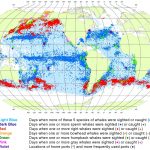 Spatial and Seasonal Distribution of American Whaling and Whales in the Age of Sail This map showing the spatial distribution of American Whaling and Whales in the 17th to 19th century was created using the AOWL data.
 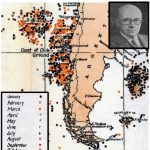 Townsend’s Whaling Charts From Townsend CH (1935) The distribution of certain whales as shown by logbook records of American whaleships. 19. Zoologica (NY): : 1–50+6 Charts. For a dataset that corresponds in part to these charts, visit Townsend’s Logbook Data → For more information and chart scans, visit WCS Canada →