About Maury’s Logbook Data
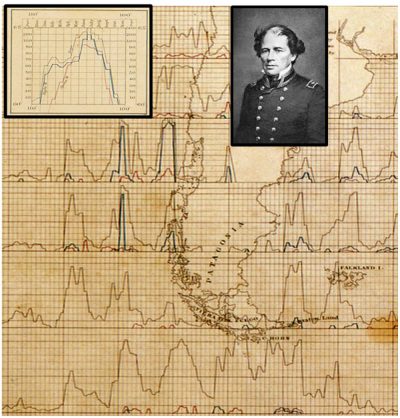
The data here were extracted from whaling logbooks by Lt. Cdr. Matthew Fontaine Maury in the 19th century. The data include information on the location of whaling vessels and whales seen or caught from late 18th to mid-19th centuries, with almost all of the data occurring in 1820–1855.
The Census of Marine Life project extracted the whale observations from original logbooks and added them to data files of vessel location and weather data prepared by NOAA. These data represent most whaling logbooks used by Maury, but some records could not be associated with specific voyages.
Complete information about the structure of the database is available in the Column Definitions. You are encouraged to submit data additions and corrections through the contact form.
Caution: In the process of creating an Index to the online Maury Abstracts available from the U.S. National Archives a ‘Note’ was found at the front of volume 65 which reveals that half-way through the process of creating the original abstracts a decision was made to abbreviate ‘right whale’ to ‘whale’.
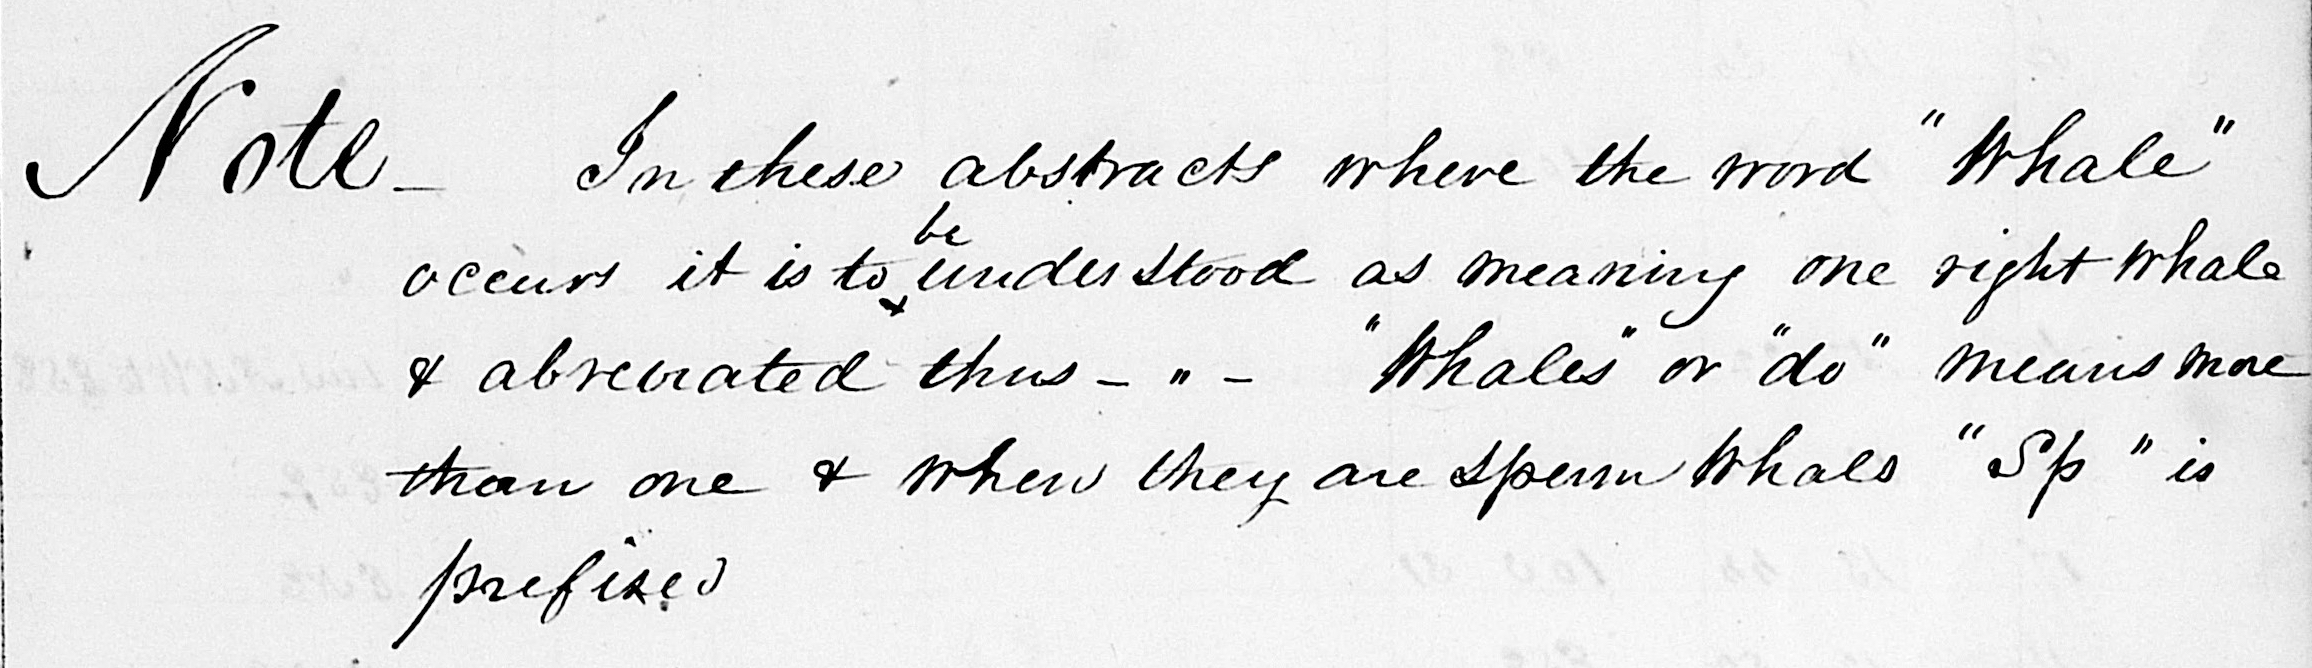
Note… In these abstracts where the word “Whale” occurs it is to be understood as meaning one right whale & abreviated [sic] thus —″— “Whales” or “do” means more than one & when they are sperm whals [sic] “Sp” is prefixed.
Research suggests that this change impacts around 1 in 3 of the 650 whaling log abstracts created by Maury’s team. Abstracts recording ‘whale’ strikes or sightings should therefore be viewed as ‘right whale’ strikes or sightings. In addition, one of the original indexers chose not to differentiate whether whales noted as ‘sighted’ were in fact struck or only sighted. (This especially impacts whaling voyages out of Sag Harbor.) The IOSRW dataset contains corrected ‘whale’ records for over 50 whaling voyages which struck or sighted right whales in the Indian Ocean. No similar corrected entries have been made for any other affected Maury Abstract data.
Related resources
- Maury’s original abstract log books have been digitized by the U. S. National Archives and Records Administration—they are available from the Maury Abstracts source page.
- An index to the Maury logbooks has been created by Dale Chatwin, allowing searches by vessel and year. Index entries have been added to AOWV voyage records, for example Almira : 1833-1837. They can be found on the WRI page for any voyage that has Maury data, in the ‘Maury Abstract Logbooks’ tab. The digitized Maury volumes contain brief lists of the major ports of call for some voyages, links to them are also available on voyage pages in the ‘Maury Abstract Logbooks’ tab, labelled ‘Places visited’.
- Maps are available for voyages with Maury data, also from voyage WRI pages in the ‘Voyage Maps’ tab. This same data is available, with maps and tables, on Tableau Public from our Related Resources page.